SpectralCumulant tutorial
In this section, we describe how to use Perturbopy to process a Perturbo 'spectral-cum' calculation.
The 'spectral-cum' calculation computes the electron-phonon cumulant spectral function. We first run the Perturbo calculation following the instructions on the Perturbo website and obtain the h5 file, ‘sto_spectral_cumulant.h5’, and YAML file, ‘sto_spectral-cum.yml’. For more information, please refer to the Perturbo website.
Next, we create the SpectralCumulant object using the h5 and YAML file as an input. This object contains all of the information from the two files.
import perturbopy.postproc as ppy

# Example using the spectral-cum calculation mode.
sc = ppy.SpectralCumulant.from_hdf5_yaml('sto_spectral_cumulant.h5', 'sto_spectral-cum.yml')
Accessing the data
The main results are stored in three attributes:
SpectralCumulant.temp_arraystores the temperatures corresponding to the spectral dataSpectralCumulant.freq_arraystores the energy values in eVSpectralCumulant.Akwstores the spectral function data, indexed by the k-point, band, temperature, and frequency
All of these attributes are arrays. Examples on how to access the data are shown below.
# There are two temperatures used in this example. Units are in K.
sc.temp_array
>> array([110., 300.])

# The range of energy values in eV used in the calculation.
sc.freq_array
>> array([-0.6, -0.5996, -0.5992, ..., 0.5992, 0.5996, 0.6])

# The step size used in the energy grid. Units are in eV.
sc.freq_step
>> array(0.0004)

# The spectral function frequencies for the first k-point,
# first band, and first temperature configuration.
sc.Akw[0][0, 0, :]
>> array([3.60912252e-04, 3.61516841e-04, 3.62122992e-04, ...,
          4.06079105e-01, 4.04920243e-01, 4.03765530e-01])

# The spectral function frequencies for the first k-point,
# second band, and first temperature configuration.
sc.Akw[0][1, 0, :]
>> array([3.63842250e-04, 3.64451850e-04, 3.65063026e-04, ...,
          4.03514361e-01, 4.02363134e-01, 4.01215968e-01])

# The spectral function frequencies for the first k-point,
# first band, and second temperature configuration.
sc.Akw[0][0, 1, :]
>> array([2.68217469e-05, 2.68033011e-05, 2.67848974e-05, ...,
          5.44580321e-01, 5.43094920e-01, 5.41611666e-01])
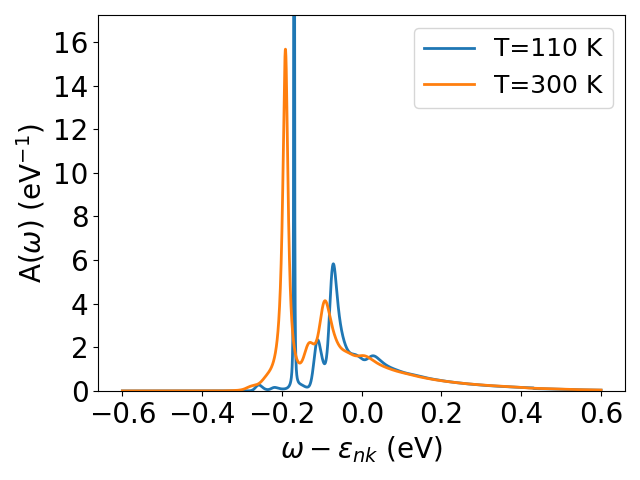
Plotting the data
We can quickly visualize the data by plotting the cumulant spectral function. If there are multiple system configurations, we can choose which temperature to plot by setting it to the desired index in the temperature array. By default, the first temperature is used. We can also choose to plot the spectral function for specific bands by setting ib to the desired band index. By default, the band index is zero.
import perturbopy.postproc as ppy
import matplotlib.pyplot as plt

# Create a figure and axis for plotting
fig, ax  = plt.subplots()

sc.plot_Aw(ax, ik=0, it=0, ib=0)
sc.plot_Aw(ax, ik=0, it=1, ib=0)
plt.show()
Finally, we can plot the spectral function for a specific k-point in the grid by setting ik. By default, the first k-point is used. Please refer to the Ephmat tutorial for details on plotting the data for different k-point indexes.